Before
The Grid
The
1811 Plan
BUILDING
THE GRID
19TH-CENTURY
DEVELOPMENT
20th century–
Now
living on
the grid
other
Grids
Living on the Grid
Traffic Light Timing
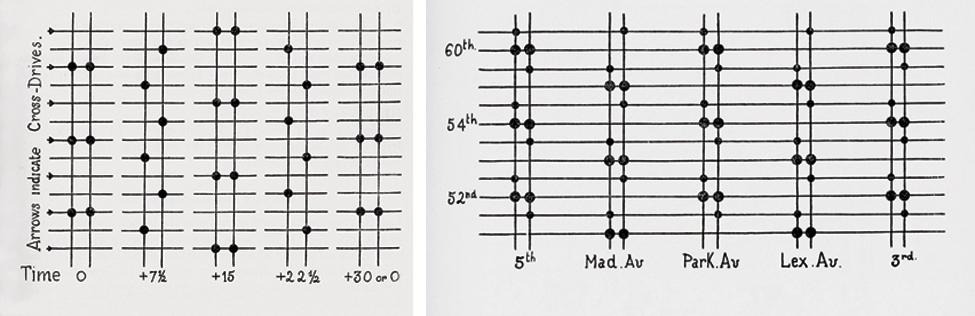


Diagrams from Pierre Zannettos,”Two-Way, Non-Stop Cross-Traffic,” in Traffic Quarterly, 1948
Public domainThese diagrams show the “progressive system,” as it was known, with traffic moving up and down the avenues. Pierre Zannettos, a civil engineer, developed the diagrams based on the New York grid to serve as a model for other gridded cities. By timing the red lights, represented by a dot, at intervals relating to the desired speed of vehicles, traffic could move for many blocks at a time without stopping.
The first drawing shows nameless streets with the seconds ticking along the bottom of the grid as each red light moves up and down the network. This system exploits the regularity of the grid. An irregular street system may need the judgment of a traffic officer to keep traffic moving efficiently, but on a grid, the correct timing can be determined with a simple algorithm relating speed to block length. Each intersection turns red every 30 seconds, with lights changing sequentially every 7½ seconds as a driver moves north or south.
The companion diagram of the “two-way traffic-drifted system” adds additional red lights to allow for better cross-town movement. This diagram shows Fifth to Third Avenues, but it applies across the grid, as the timing remains the same as long as the blocks are the standard 200 feet. JR